Blockchain is like a digital notebook that lives on thousands of computers around the world. Every transaction, every token movement, and every contract is written down in this notebook forever. That makes it secure, transparent, and nearly impossible to tamper with.
But here’s the issue: reading it is not easy.
When most people open a blockchain explorer, they see nothing but long wallet addresses, endless codes, and timestamps that make little sense. It feels less like a notebook and more like a secret codebook. Transparency is there, but clarity is not.
This is why blockchain visualization matters so much. Instead of dumping unreadable text, visualization turns the blockchain into a story you can see. Shapes, colors, and flows replace confusing strings of numbers.
That’s exactly what Hindsight VIP was built to do.
For a primer, check out Blockchain Analytics Made Simple.
What Is Blockchain Visualization?
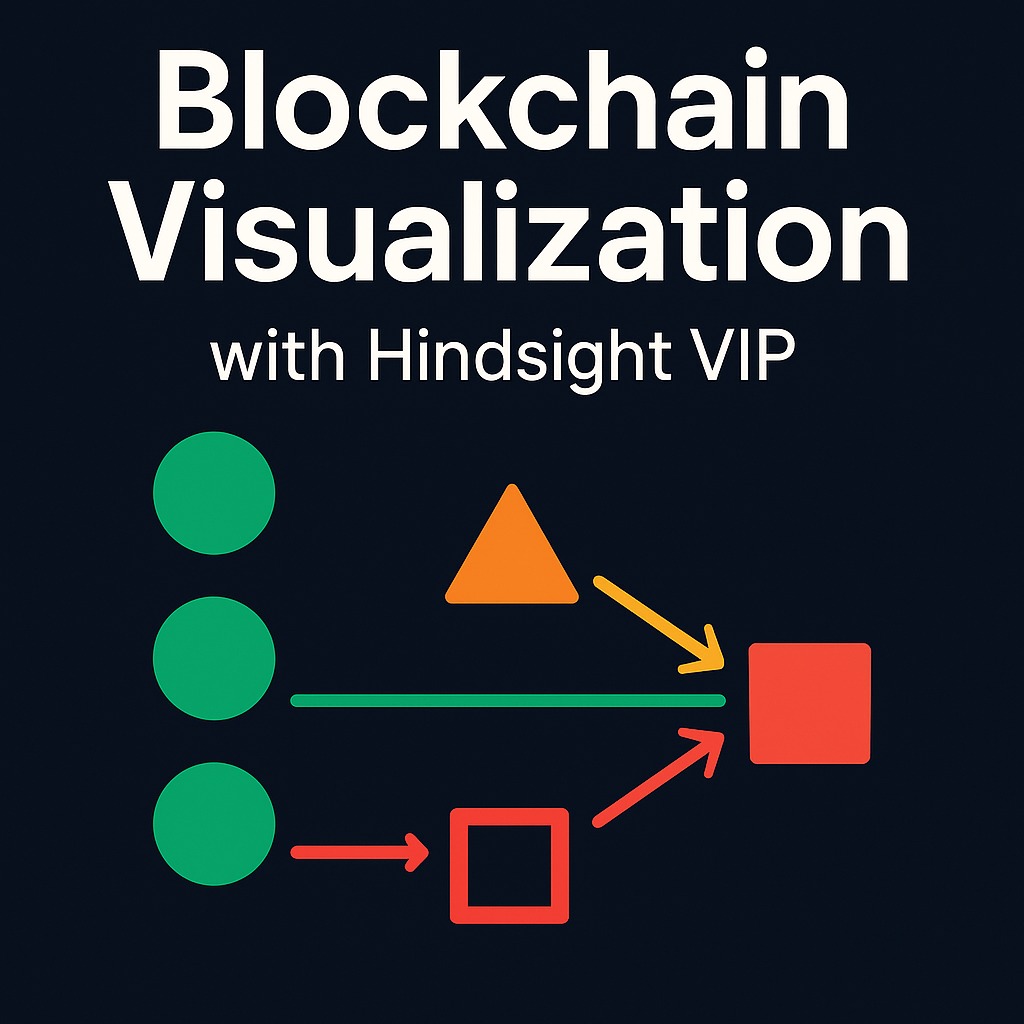
At its core, blockchain visualization is the process of turning complex blockchain data into pictures. Instead of seeing only code, you see:
- Shapes: Rings for wallets, squares for contracts, triangles for exchanges.
- Colors: Green for safe activity, orange for caution, red for scams.
- Lines: Showing how money moves between different entities.
This approach works because humans process visuals much faster than text. In fact, studies show the brain interprets images 60,000 times faster than written information (Scientific American).
Think of it like switching from reading a bus schedule to looking at a subway map. The schedule has every detail, but the map tells you the story instantly.
Why Raw Blockchain Data Creates Problems
The Transparency Paradox
Blockchains are open and public. But if almost no one can understand the data, that openness is meaningless. This gap is called the transparency paradox.
- Wallets look like random strings:
0x83a2ff29a0c…
- Transactions show up as long hashes with no context.
- Contracts hide risk in technical language.
For most users, it’s impossible to tell what’s safe and what’s risky. As a result, scams slip by unnoticed.
We broke this down further in Blockchain Isn’t Broken. Trust Is..
How Hindsight VIP Solves the Problem
Hindsight VIP builds visual blockchain tools that make the story visible.
Shapes That Tell Stories
- Rings = Wallets. Large rings mean whales (big holders). Small rings mean regular users.
- Squares = Contracts. These represent NFTs, DeFi apps, or staking platforms.
- Triangles = Exchanges. Easy to spot trading platforms and liquidity pools.
- Colors = Safety signals. Green is safe, orange means caution, red warns of scams.
Connections That Explain Movement
Lines and arrows show how tokens move. Instead of guessing, you see flows instantly—like footprints leading from one wallet to another.
A User-Friendly Interface
No coding. No technical jargon. Just a clean interface that feels like exploring a map.
Smart Contracts Made Easy
Smart contracts are programs that run automatically on the blockchain. They power NFT sales, DeFi lending, and token swaps. But they’re often confusing.
With Hindsight VIP, smart contracts are visualized step by step.
- Arrows show how funds move.
- Squares highlight which contract is active.
- Colors warn if risk is present.
This makes smart contracts less like black boxes and more like guided tours.
Accessibility: A Tool for All Users
Not everyone learns best from text. Many people, including those with dyslexia or neurodivergence, process information visually. Hindsight VIP was built with this in mind.
- Beginners: No need for technical knowledge.
- Students: A teaching tool in schools for finance, supply chains, and blockchain coding.
- Law enforcement: Easier to trace illegal activity and follow suspicious flows.
- Neurodivergent users: Reduced overload thanks to clear, simple visuals.
Blockchain visualization makes the ecosystem more inclusive.
Security Features That Protect Users
Clarity matters, but safety is critical. Hindsight VIP builds security directly into its visualization.
- Wallet clustering: Suspicious wallets are grouped together.
- Risk alerts: Colors signal scams, rug pulls, and sudden sell-offs.
- Logo tagging: Company logos appear in flows, so users instantly know who they’re dealing with.
This transforms visualization from just being educational into being protective.
More in What is Crypto Analytics?
Built for Developers and Businesses
Hindsight VIP isn’t just for personal use. It’s also designed for enterprises, developers, and institutions.
- Supports Ethereum, Solana, Arbitrum, and XRPL.
- Expansion plans include Bitcoin and other Xpub blockchains.
- APIs and graphing libraries in development.
- Machine learning to classify smart contracts automatically.
For businesses, this means real-time insights without relying on third-party services.
Real-World Scenarios Where Visualization Helps
1. Wallet Poisoning
Scammers create fake wallets that look almost identical to real ones. In Hindsight VIP, their disconnected flows reveal them instantly.
2. Bridge Exploits
Hackers move funds across chains to hide stolen money. Big red arrows on the map show where the funds exit.
3. NFT Rug Pulls
Projects lure people in, then drain all funds. Visualization exposes the scam by showing liquidity collapsing into a single wallet.
Without visualization, users only see long codes. With it, they see the truth.
Why Blockchain Visualization Builds Trust
Blockchain adoption has stalled. Global ownership sits at under 7%. Why? Because people don’t trust what they can’t understand.
Visualization changes that by giving people clarity. When you understand, you feel confident. When you feel confident, you engage more.
Trust is not optional. It’s the foundation of adoption.
Case Study: From Confusion to Confidence
Imagine a first-time user buying an NFT. On a normal explorer, they see only:
- A wallet address.
- A contract hash.
- Numbers that don’t mean much.
In Hindsight VIP, they see:
- A square for the contract.
- A ring for their wallet.
- An arrow showing funds flowing to a verified address.
Suddenly, they know what’s happening. Confidence replaces confusion.
Education: How Visualization Helps Schools
Blockchain isn’t just for traders. It’s becoming part of business, law, and computer science education. Visualization helps schools by:
- Teaching how supply chains use blockchain.
- Showing DeFi lending step by step.
- Helping students understand coding through contract flows.
Instead of abstract theory, they get living diagrams.
Law Enforcement: Fighting Fraud with Visualization
Crypto crime is rising. In 2023 alone, $1.7 billion was lost to scams (Chainalysis).
For investigators, raw blockchain data is overwhelming. Visualization simplifies this:
- Wallet rings cluster suspicious actors.
- Flow arrows reveal laundering paths.
- Colors highlight red-flag behavior.
It’s not just faster. It’s also more accurate.
The Future of Blockchain Visualization
The crypto fraud crisis proves that blockchain needs better tools. Data without clarity is dangerous.
Blockchain visualization is the bridge between raw transparency and real trust. It makes blockchain readable, safe, and ready for adoption.
How You Can Try It
You don’t need to be technical. Getting started is simple:
- Open Hindsight VIP Explorer.
- Paste in a wallet or transaction.
- Watch as it turns into rings, squares, and arrows that tell the story.
In seconds, the blockchain becomes less like a puzzle and more like a map.
Conclusion: The Story in Shapes and Colors
Blockchain isn’t broken, it’s just unreadable. With blockchain visualization, Hindsight VIP changes that.
Instead of endless code, you see a living story told in shapes, colors, and flows. Instead of confusion, you get confidence.
The future of blockchain isn’t written in numbers. It’s drawn in visuals. And with Hindsight VIP, everyone can finally read it.